
NSX day two operations – Understanding Networking and Security Configurations
Network administrators and security personnel often need to review network and security logs. This is often required for auditing or troubleshooting as well as security analysis.
VMware Cloud on AWS integrates all its logs in VMware Aria Operations for Logs.
This capability allows customers to analyze and troubleshoot their application flows using the visibility of packets corresponding to specific NSX firewall rules and have visibility of the connectivity establishment of VPNs. Once a firewall rule has been created on one of the gateways or the DFW firewall, logging can then be turned on directly from the rule by clicking on the right-hand side of the cogwheel and enabling Logging, as seen in the following screenshot:
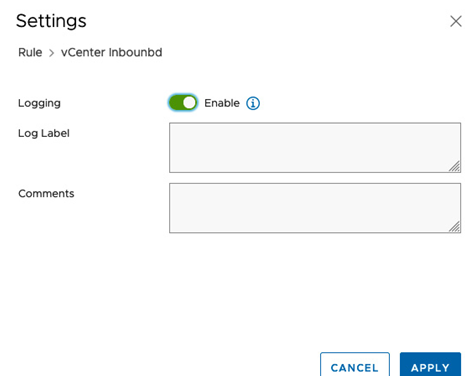
Figure 6.56 – NSX-T firewall rule logging enabled
The rule ID can be seen in the ID field. In this example it is 1017, as seen in the following screenshot:
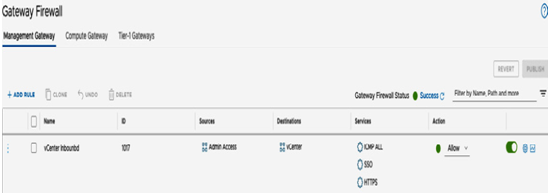
Figure 6.57 – Rule ID Gateway Firewall
This rule ID can be used to filter log results later in VMware Aria Operations for Logs, as seen in the following screenshot:
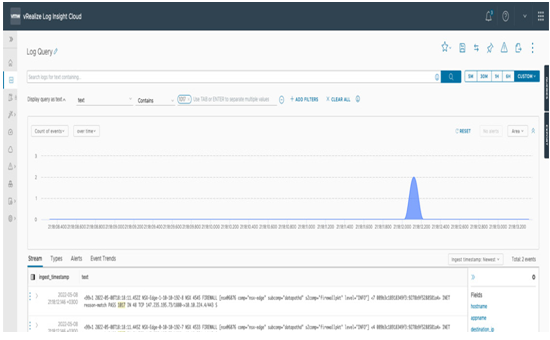
Figure 6.58 – vRealize Log Insight Cloud
When looking at these logs, customers can drill down to see the specific packet-level details. Traffic can be allowed through the firewall action (pass).
We’ll explore more VMware Aria Operations for Logs configuration options in the next chapter.
IPFIX
Security and network administrators use Internet Protocol Flow Information Export (IPFIX) and its predecessor, NetFlow, for troubleshooting and auditing. IPFIX, a modern IETF standard protocol for exporting traffic flow information, is based on NetFlow.
A flow is a sequence of packets sent in a given time slot and sharing the same 5-tuple values of source IP address, source port, destination IP address, destination port, and protocol. The flow information can include properties such as timestamps, packet/byte counts, input/output protocols, TCP flags, and encrypted flow information.
An IPFIX specification requires the identification of exporters and network entities that monitor traffic and export it in the IPFIX model. Collectors are systems that collect the traffic.
If there is IP connectivity from VMware Cloud On AWS, an IPFIX collector can be placed anywhere on the network. It could reside on-premises, within a VMware Cloud on AWS SDDC, or in AWS.
The configuration of the IPFIX collector is done in the IPFIX section, on the Plan & Troubleshoot tab. IPFIX data can also be sent to as many as four collectors:
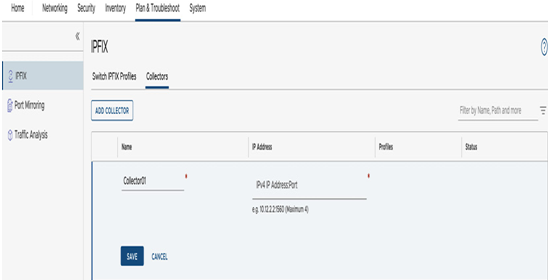
Figure 6.59 – IPFIX collector
Many IPFIX settings are customizable; for example, individual network segments can also be selected. The IPFIX collector captures all flows from VMs connected with those network segments.
Customers can adjust the sampling rate or timeout parameters to control how finely customers want data to be captured. If there are many flows, customers can lower the sampling rate. A lower sampling rate will reduce the number of processed packets, which will reduce the load on the customer’s underlying platform. This configuration is done in the IPFIX Switch IPFIX Profiles section, as seen in the following screenshot:
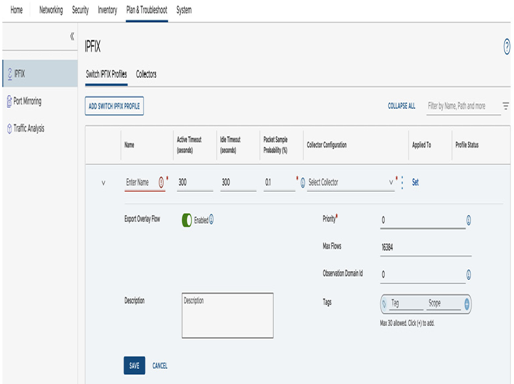
Figure 6.60 – Switch IPFIX Profiles